Introduction
In the February 2024 release of Microsoft’s Power BI Desktop, a groundbreaking approach to calculations was introduced: Visual Calculations. Representing a DAX (Data Analysis Expressions) calculation, Visual Calculations are defined and executed directly on a visual element. This innovative method allows referencing of any data within the visual, encompassing columns, measures, or other visual calculations. The adoption of Visual Calculations not only streamlines DAX complexity but also facilitates easier maintenance, ultimately contributing to enhanced performance.
How does Visual Calculation differ from other calculation options?
- Visual calculations are stored on the visual, not in the model.
- Visual calculations can only refer to elements present in the visual.
- They combine the simplicity of context from calculated columns with the on-demand calculation flexibility from measures
- In contrast to measures, visual calculations operate on aggregated data, often leading to better performance.
| Aspect | Measure | Visual calculation |
| Language | DAX | DAX |
| Context | Filter | Visual |
| Stored in | Model | Visual |
| Computed at | On-demand | On-demand |
| Applies User Interaction | Yes | Yes |
How to use Visual Calculations?
To leverage visual calculations, enable this feature in Options and Settings > Options > Preview features. Simply choose ‘Visual calculations’ and click ‘OK.’ Remember, the activation of visual calculations takes effect upon restarting the Power BI Desktop.
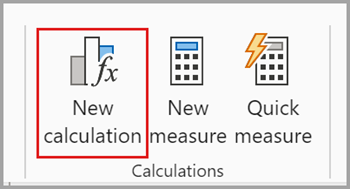
To add a visual calculation, first select a visual. Then, select the New Calculation button in the ribbon
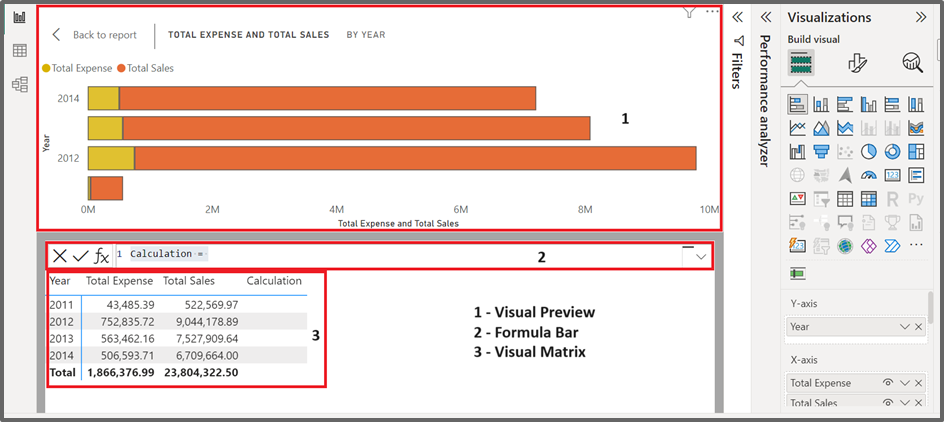
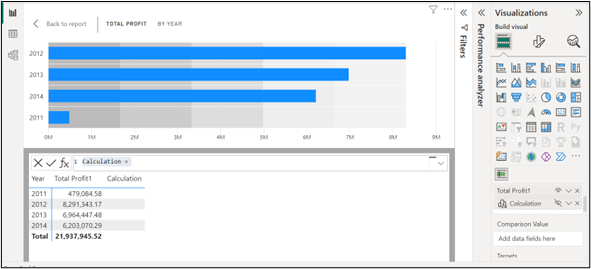
The visual calculations window opens in Edit mode. The Edit mode screen consists of three major sections:
- Visual Preview: shows a preview of the visual that we are working with
- A formula bar: we can write visual calculation Dax expression
- The visual matrix: displays the results of visual calculations in table format.
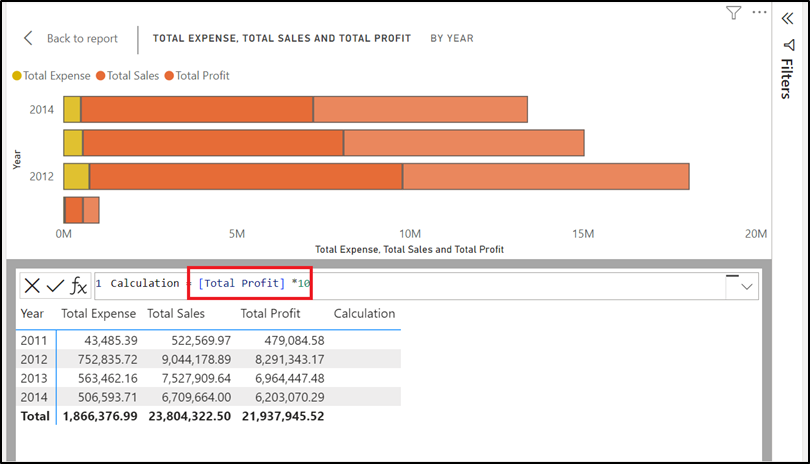
In the formula bar, we can write a visual query in DAX. For example, if we want to find the total profit from the below visual using [Total Expense] and [Total Sales] by year, it would be easier like below.

We can make use of this visual calculation [Total Profit] for writing another calculation in the same visual.
However, it is not possible to use other measures or columns that are not used on the respective visual. Another interesting fact is that we can hide fields from visuals in the edit mode. Hiding fields does not eliminate them from the visual or the visual matrix, allowing your visual calculations to retain references and functionality. For example, if we want to hide [Total Sales] and [Total Expenses] from the visual, just hide them in the edit mode like below.

This new feature supports third-party visuals as well. Just tried to replicate the same on a bullet chart by OKVIZ.
Using Templates
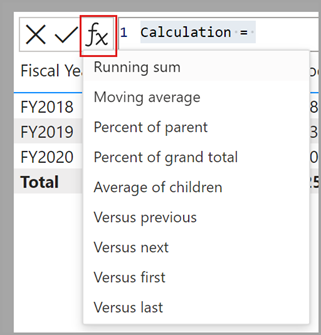
To simplify the creation of common calculations, visual calculations offer templates. Access these templates by clicking the template button fx and selecting the desired template to use. Using the templates we can write complex DAX queries easily.
Visual calculations support the utilization of numerous existing DAX functions. However, it’s important to note that, due to their operation within the visual matrix, functions dependent on model relationships, such as USERELATIONSHIP, RELATED, or RELATED TABLE, are not accessible in this context.
Considerations and Limitations
When writing this blog in Feb 2024, the below features are not available.
| Feature | Description |
| Filters on visual | We can’t filter on visuals |
| Personalization | Personalization of visual calculations or hidden fields isn’t available |
| Publish to web | We can’t use the Publish to web functionality with reports that use visual calculations or hidden field |
| Custom Format Strings | We can’t set built-in or custom format strings on visual calculations. |
| Conditional Formatting | We can’t apply conditional formatting on visual calculations. |
| Data categories | We can’t set data categories on visual calculations. |
| Aggregations | We can’t change aggregations on visual calculations. |
| Field Parameters | We can’t use field parameters with visual calculations. |
| Drill through | We can’t use the see records drill-through functionality with visuals that use visual calculations or hidden fields. |
| Power BI service | Editing visual calculations or hidden fields in the Power BI service is not supported |
Observations
Not all visual types support visual calculations. Only the below set of visuals is supported.
- Visual Calculations support both implicit measures and explicit measures
- It supports the Comment Line

3. Hide from visual is a new feature

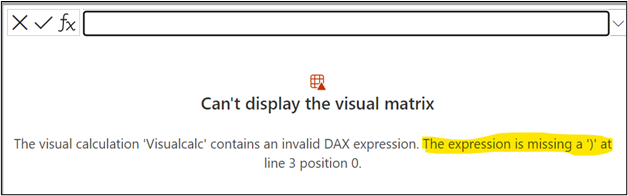
4. Auto Correction is not supported yet.
Author: Team PowerBI
https://learn.microsoft.com/en-us/power-bi/transform-model/desktop-visual-calculations-overview
https://learn.microsoft.com/en-us/power-bi/transform-model/desktop-calculations-options